Free online color visualizer. Just enter a list of color names or codes in the options, and the program will instantly create an image with these colors for you. You can adjust the layout and size of the color blocks, as well as add labels to the color names. Created by engineers from team Browserling.
Free online color visualizer. Just enter a list of color names or codes in the options, and the program will instantly create an image with these colors for you. You can adjust the layout and size of the color blocks, as well as add labels to the color names. Created by engineers from team Browserling.
This tool allows you to visualize multiple colors at once and create custom color palettes. It's especially useful for designers, illustrators, artists, and anyone else working with color who needs a quick and clear way to see how well specific colors go together. It also allows you to explore and compare various color models. In the tool options, you can specify a list of colors to visualize, and in the output editor, they'll be neatly arranged in color blocks or strips. You can enter one or more colors for visualization (one per line) or paste a vertical list of colors. The tool supports a wide range of color formats, including simple English color names (e.g., "blue" or "orange"), HTML and CSS colors (e.g., "tomato" or "cornflowerblue"), HEX codes (e.g., "#0000ff" for blue and "#ffa50080" for 50% transparent orange), RGB/RGBA codes (e.g., "rgb(0, 0, 255)" for blue and "rgba(255, 165, 0, 1)" for orange), HSL codes (e.g., "hsl(240, 100%, 50%)" for blue and "hsl(38.8, 100%, 50%)" for orange), HSV codes (e.g., "hsv(240, 100, 100)" for blue and "hsv(38.8, 100, 100)" for orange), HSI codes (e.g., "hsi(240, 100, 33.3)" for blue and "hsi(39.6, 100, 54.9)" for orange), LAB codes (e.g., "lab(32.3, 79.2, -107.9)" for blue and "lab(74.9, 23.9, 78.9)" for orange), LCH codes (e.g., "lch(32.3, 133.8, 306.3)" for blue and "lch(74.9, 82.5, 73.1)" for orange), HCL codes (e.g., "hcl(306.3, 133.8, 32.3)" for blue and "hcl(73.1, 82.5, 74.9)" for orange), CMYK codes (e.g., "cmyk(100%, 100%, 0%, 0%)" for blue and "cmyk(0%, 35.3%, 100%, 0%)" for orange), YIQ codes (e.g., "yiq(0.114, -0.321, 0.311)" for blue and "yiq(0.679, 0.418, -0.127)" for orange), YCbCr codes (e.g., "ycbcr(32, 240, 118)" for blue and "ycbcr(164, 46, 174)" for orange), XYZ codes (e.g., "xyz(0.18, 0.072, 0.95)" for blue and "xyz(0.547, 0.482, 0.064)" for orange), LUV codes (e.g., "luv(32.3, -9.41, -130.34)" for blue and "luv(74.94, 74.85, 74)" for orange), OKLab codes (e.g., "oklab(0.452, -0.032, -0.312)" for blue and "oklab(0.793, 0.057, 0.161)" for orange), YCoCg codes (e.g., "ycocg(0.25, -0.5, -0.25)" for blue and "ycocg(0.574, 0.5, 0.074)" for orange), and YCgCo codes (e.g., "ycgco(0.25, -0.25, -0.5)" for blue and "ycgco(0.574, 0.074, 0.5)" for orange). YCbCr values are also supported in two formats. The YCbCr(…) format uses the limited value range (typically found in digital video), where Y takes values from 16 to 235, and Cb and Cr are from 16 to 240. If you need a full-range 8-bit precision, use the YCbCr2(…) format instead. For example, YCbCr2(0, 255, 0) – where Y, Cb, and Cr can range from 0 to 255. In the options, you can also choose between two color arrangement modes: horizontal or vertical. In horizontal mode, the colors are placed from left to right, one after another, as tall strips. In vertical mode, the colors appear as a stack of wide strips going from top to bottom. For each arrangement type, you can specify the width and height of the color strips in pixels. Additionally, you can customize the background color behind the colors. By default, the background is transparent, but you can change it to any other color. If you're working with semi-transparent colors, a solid background will help you see how those colors will look when they are layered and blended. You can also set a gap between color blocks to create space between them. To prevent the blocks from touching the edges of the canvas, you can add padding around the entire visualization. For easier color identification, you can enable the option to display the name or code of each color directly on its block. Additionally, you can enable a thin stroke around each color block, which helps visually separate similar or identical colors. This is especially useful when working with various white shades on a white background. Image-abulous!
This tool allows you to visualize multiple colors at once and create custom color palettes. It's especially useful for designers, illustrators, artists, and anyone else working with color who needs a quick and clear way to see how well specific colors go together. It also allows you to explore and compare various color models. In the tool options, you can specify a list of colors to visualize, and in the output editor, they'll be neatly arranged in color blocks or strips. You can enter one or more colors for visualization (one per line) or paste a vertical list of colors. The tool supports a wide range of color formats, including simple English color names (e.g., "blue" or "orange"), HTML and CSS colors (e.g., "tomato" or "cornflowerblue"), HEX codes (e.g., "#0000ff" for blue and "#ffa50080" for 50% transparent orange), RGB/RGBA codes (e.g., "rgb(0, 0, 255)" for blue and "rgba(255, 165, 0, 1)" for orange), HSL codes (e.g., "hsl(240, 100%, 50%)" for blue and "hsl(38.8, 100%, 50%)" for orange), HSV codes (e.g., "hsv(240, 100, 100)" for blue and "hsv(38.8, 100, 100)" for orange), HSI codes (e.g., "hsi(240, 100, 33.3)" for blue and "hsi(39.6, 100, 54.9)" for orange), LAB codes (e.g., "lab(32.3, 79.2, -107.9)" for blue and "lab(74.9, 23.9, 78.9)" for orange), LCH codes (e.g., "lch(32.3, 133.8, 306.3)" for blue and "lch(74.9, 82.5, 73.1)" for orange), HCL codes (e.g., "hcl(306.3, 133.8, 32.3)" for blue and "hcl(73.1, 82.5, 74.9)" for orange), CMYK codes (e.g., "cmyk(100%, 100%, 0%, 0%)" for blue and "cmyk(0%, 35.3%, 100%, 0%)" for orange), YIQ codes (e.g., "yiq(0.114, -0.321, 0.311)" for blue and "yiq(0.679, 0.418, -0.127)" for orange), YCbCr codes (e.g., "ycbcr(32, 240, 118)" for blue and "ycbcr(164, 46, 174)" for orange), XYZ codes (e.g., "xyz(0.18, 0.072, 0.95)" for blue and "xyz(0.547, 0.482, 0.064)" for orange), LUV codes (e.g., "luv(32.3, -9.41, -130.34)" for blue and "luv(74.94, 74.85, 74)" for orange), OKLab codes (e.g., "oklab(0.452, -0.032, -0.312)" for blue and "oklab(0.793, 0.057, 0.161)" for orange), YCoCg codes (e.g., "ycocg(0.25, -0.5, -0.25)" for blue and "ycocg(0.574, 0.5, 0.074)" for orange), and YCgCo codes (e.g., "ycgco(0.25, -0.25, -0.5)" for blue and "ycgco(0.574, 0.074, 0.5)" for orange). YCbCr values are also supported in two formats. The YCbCr(…) format uses the limited value range (typically found in digital video), where Y takes values from 16 to 235, and Cb and Cr are from 16 to 240. If you need a full-range 8-bit precision, use the YCbCr2(…) format instead. For example, YCbCr2(0, 255, 0) – where Y, Cb, and Cr can range from 0 to 255. In the options, you can also choose between two color arrangement modes: horizontal or vertical. In horizontal mode, the colors are placed from left to right, one after another, as tall strips. In vertical mode, the colors appear as a stack of wide strips going from top to bottom. For each arrangement type, you can specify the width and height of the color strips in pixels. Additionally, you can customize the background color behind the colors. By default, the background is transparent, but you can change it to any other color. If you're working with semi-transparent colors, a solid background will help you see how those colors will look when they are layered and blended. You can also set a gap between color blocks to create space between them. To prevent the blocks from touching the edges of the canvas, you can add padding around the entire visualization. For easier color identification, you can enable the option to display the name or code of each color directly on its block. Additionally, you can enable a thin stroke around each color block, which helps visually separate similar or identical colors. This is especially useful when working with various white shades on a white background. Image-abulous!
In this example, we visualize a single color by entering its name, "LightSalmon". This allows us to quickly see how the named color looks without needing to know its HEX or RGB code. The tool supports the visualization of nearly 150 named colors, including standard English colors, extended HTML color constants, and CSS color names, such as "Red", "Yellow", "Turquoise", or "DodgerBlue". The color is displayed as a 400×400 square without an additional stroke, padding, or color name label.

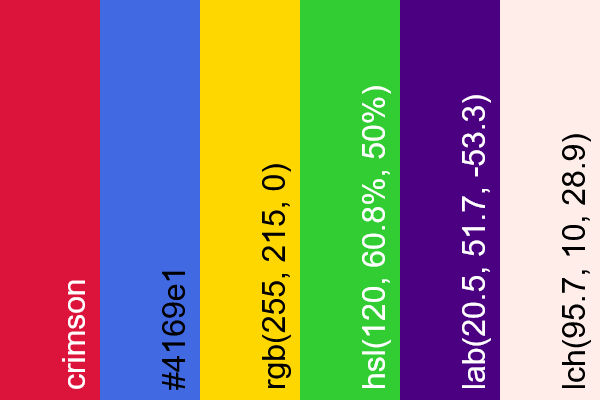
This example visualizes several colors specified in different formats. The list includes six colors: a named color, a HEX code, an RGB value, an HSL value, and colors in the Lab and LCH formats. The tool arranges these colors in order from left to right as thin vertical blocks. Each block shows the color's name or code in the format it was originally entered in the color list.
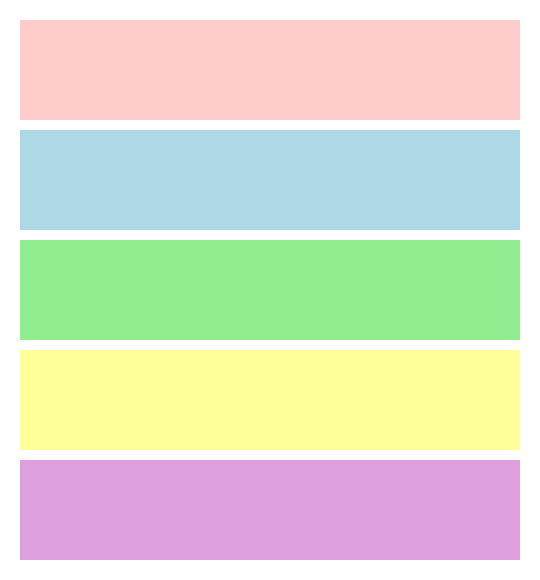
In this example, we create a gentle and refreshing spring-themed color palette. It includes soft pink, light blue, pastel green, pale yellow, and plum hues, specified using HEX codes in the color definition list. The colors are arranged vertically as long strips. There are 10-pixel gaps between them and a transparent 20-pixel padding around the whole visualization.
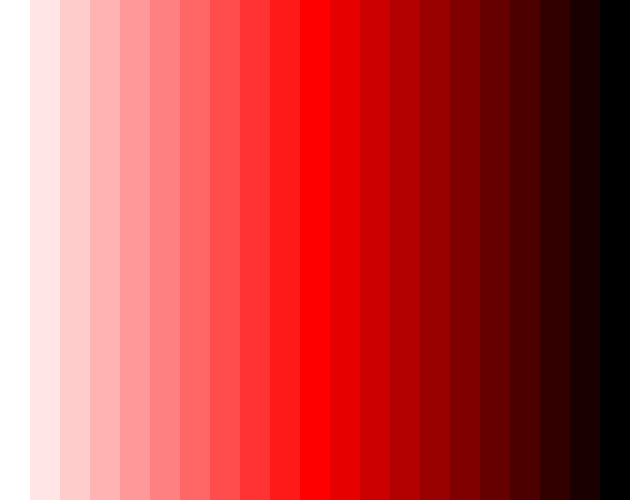
In this example, we generate a set of colors using the HSL color model. All colors have the same "H" (hue) and "S" (saturation) values and they differ only by their "L" (lightness) value, which ranges from 100% to 0%. The lightness of 100% represents maximum brightness, resulting in a pure white color, while 0% represents the absence of light, appearing as a pure black color. At 50% lightness (in the middle of the color set), we see the true red color. This visualization demonstrates the structure of the HSL model and shows the role of the lightness value. Each color block is vertical, arranged from left to right, creating a smooth gradient effect.
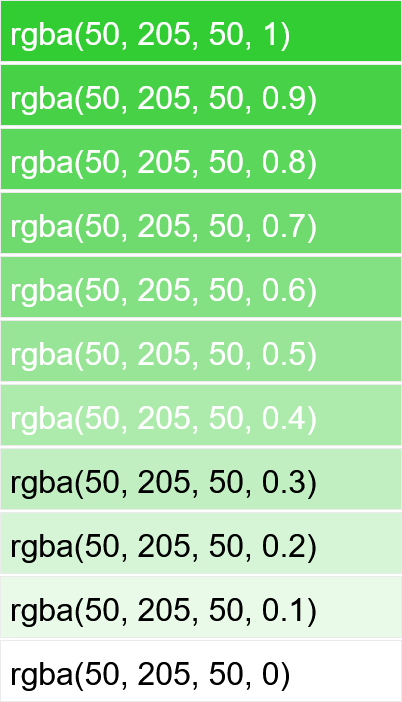
In this example, we visualize the alpha channel (transparency) of the RGBA color model. We draw eleven variations of the limegreen color, defined by the RGBA color code "rgba(50, 205, 50, A)", where the alpha value "A" ranges from 1 (fully opaque) to 0 (fully transparent). We stack the colors vertically with a small gap between them and add a stroke around each color to clearly separate the colors.
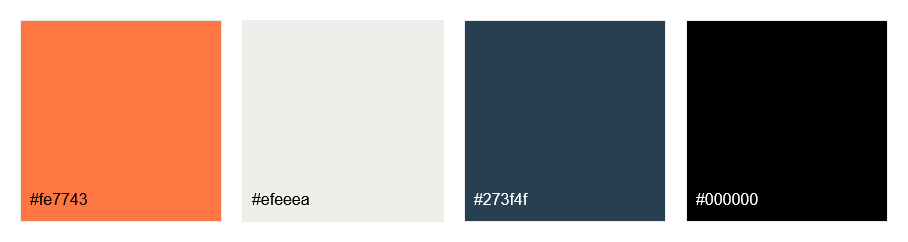
In this example, we're working on a color palette for a mobile app interface design. We've carefully selected the following four shades: "#fe7743", "#efeeea", "#273f4f", "#000000". Each color is displayed in a 200×200 pixel block, arranged horizontally with a 20-pixel separator. We also display the HEX code of each color in the lower left corner of the block to quickly identify the color by its code.
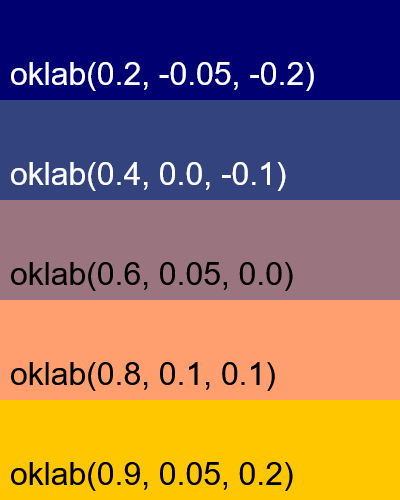
In this example, we visualize an incremental sequence of colors within the OKLab color space. We convert five OKLab color codes into an image, and in each color code, we increment the lightness and chromatic components. The lightness component gradually increases from 0.2 to 0.9, transitioning from dark, muted tones to bright highlights. At the same time, the "a" and "b" chroma components shift from cool bluish hues to warm reddish and yellowish ones.
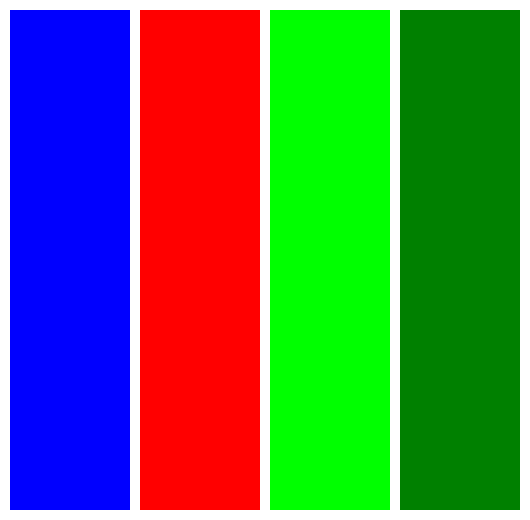
This example explores the results of combining primary CMYK components at their maximum values. We observe that in the first color, a mix of 100% Cyan and 100% Magenta produces "blue". In the second color, a mix of 100% Magenta and 100% Yellow creates "red". In the third color, a mix of 100% Cyan and 100% Yellow yields "lime". These combinations closely match the primary colors of the RGB color space. Additionally, we convert a fourth color code with a mix of 100% Cyan and 100% Yellow but with the black (K) component set to 50%, which shifts the resulting color from "lime" toward "green".
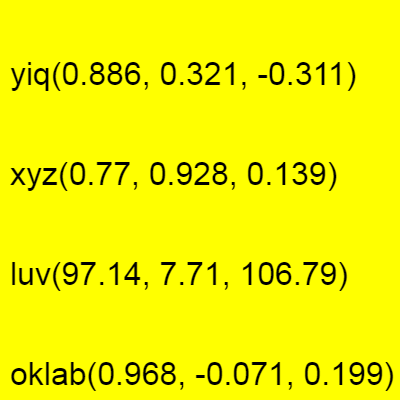
In this example, we use the color visualization tool to verify if different color codes from various color systems – specifically YIQ, XYZ, LUV, and OKLab – can represent the exact same color. We display these colors next to each other and remove the stroke around them to help us clearly see that the color tones don't change from color to color. After visually inspecting the colors, you can confidently confirm that all these color codes indeed correspond to the same yellow tone.
Edit images in your browser.
Place images on a grid so that they make a Fibonacci spiral.
Convert a PNG image to an ICO icon.
Convert an ICO icon to a PNG image.
Convert a PNG image to a TIFF image.
Convert a TIFF image to a PNG image.
Convert a JPEG image to an ICO icon.
Convert an ICO icon to a JPEG image.
Convert a JPEG image to a TIFF image.
Convert a TIFF image to a JPEG image.
Convert a GIF image to an ICO icon.
Convert an ICO icon to a GIF image.
Convert a GIF image to a TIFF image.
Convert a TIFF image to a GIF image.
Convert a GIF image to an APNG icon.
Convert an APNG image to a PNG image.
Convert a bitmap image to an ICO icon.
Convert an ICO icon to a bitmap image.
Convert a bitmap image to a TIFF image.
Convert a TIFF image to a bitmap image.
Convert a Webp image to an ICO icon.
Convert an ICO icon to a Webp image.
Convert a Webp image to a TIFF image.
Convert a TIFF image to a Webp image.
Create an animated GIF image from static frames.
Create an image from an B, G, R array.
Create an image from an R, G, B, A array.
Create an image from an B, G, R, A array.
Increase the quality of an image.
Decrease the quality of an image.
Remove the pixelation effect from an image.
Remove the blur effect from an image.
Apply OCR on an image and extract all text from it.
Erase text or label from an image.
Erase any object from an image.
Convert an image to a thumbnail
Convert a PNG, GIF, JPG or BMP to glitch art.
Let Zalgo destroy an image.
Change an image color space to HSL, HSV, CMYK, or RGB.
Change an image bit depth to 32, 24, 16, 8, 4, 2 bits or just 1 bit.
Create a mosaic wall from multiple images.
Create an ASCII art image from a regular image.
Create an ANSI art image from a regular image.
Create a Unicode art image from a regular image.
Create a Braille art image from a regular image.
Add a short one-line label to an image.
Remove a watermark from an image.
Create an image made out of dots of varying size and spacing.
Convert an image to a bunch of blocks.
Create a GIF from the original image with interlacing effect.
Subscribe to our updates. We'll let you know when we release new tools and features, and when we organize online workshops.
Enter your email here
We're Browserling — a friendly and fun cross-browser testing company powered by alien technology. At Browserling we love to make people's lives easier, so we created this collection of image editing tools. Our tools have the simplest user interface that doesn't require advanced computer skills and they are used by millions of people every month. Our image tools are actually powered by our web developer tools that we created over the last couple of years. Check them out!